Syntax
Basic Elements

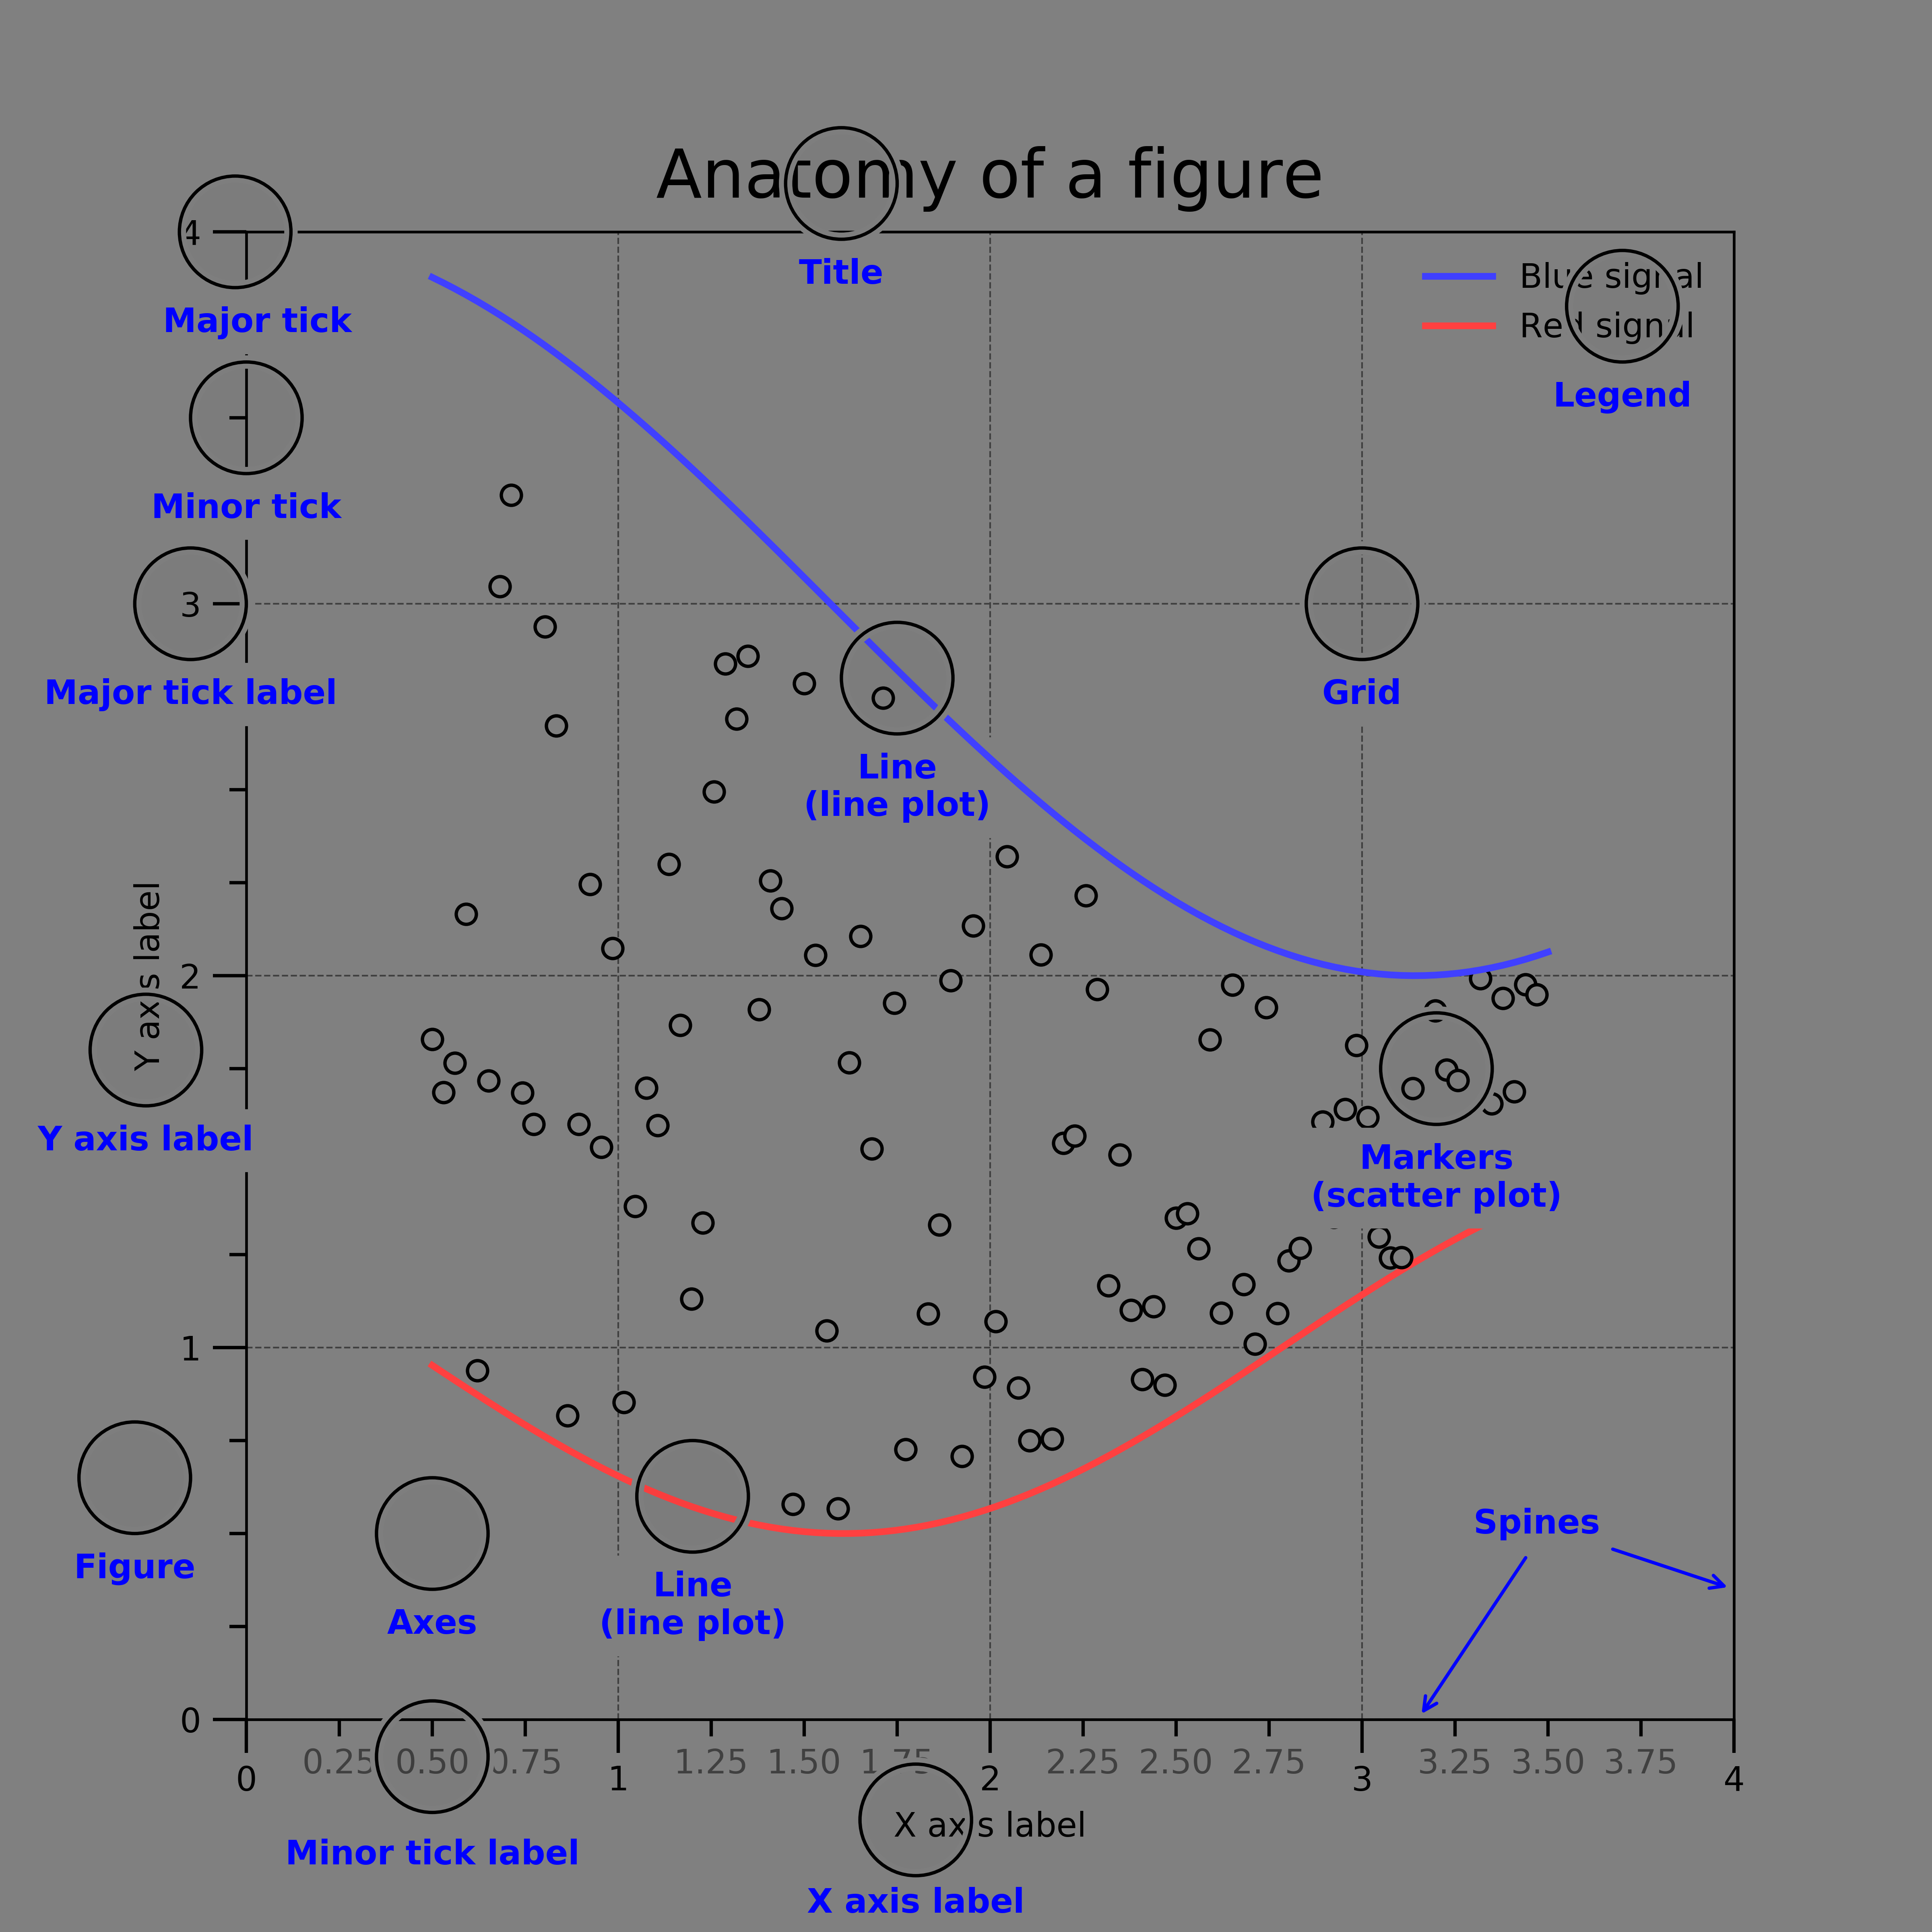
注意,此图像和原始的图像解剖图及代码不同,对图像色彩进行了调整,将图像灰度化,更适合黑暗模式。修改后的代码见附录。
A simple example
效果

Subfigures
  # -*- coding:utf-8 -*-
  import numpy as np
  import matplotlib.pyplot as plt
  ax1=plt.subplot2grid((3,3),(0,0),colspan=2) # 第一行的子图占据两列
  ax2=plt.subplot2grid((3,3),(1,0))
  ax3=plt.subplot2grid((3,3),(1,1),rowspan=2) # 第二列子图占据两行
  ax4=plt.subplot2grid((3,3),(2,0))
  ax5=plt.subplot2grid((3,3),(0,2),rowspan=3)
  for i, ax in enumerate(plt.gcf().axes):
      ax.text(0.5, 0.5, "ax%d" % (i+1), va="center", ha="center")
  plt.suptitle('GridSpec example')
  plt.tight_layout()
  plt.subplots_adjust(top=0.9)
  plt.savefig('grid-example.png',dpi=300)
  #plt.show()

Dynamic Subfigures
import matplotlib.pyplot as plt
# Start with one
fig = plt.figure()
ax = fig.add_subplot(111)
ax.plot([1,2,3])
# Now later you get a new subplot; change the geometry of the existing
n = len(fig.axes)
for i in range(n):
	    fig.axes[i].change_geometry(n+1, 1, i+1)
# Add the new
ax = fig.add_subplot(n+1, 1, n+1)
ax.plot([4,5,6])
plt.show()
Share X/Y label
- 思路:画完多个子图后,加一个大Axes,在该Axes上添加
xlable,ylabel - 效果:

Sharing Y axes
- 示例

- 代码
Axes iteration
遇到不确定个数的axes时,迭代figure.axes达到自适应布局的目的
nrow=2
ncol=4
fig,ax=plt.subplots(nrow,ncol,figsize=(ncol*5,nrow*5))
for i, ax in enumerate(fig.axes):
    ax.plot(x,y)
Line Markers
Markers 适合将点连成线的图像

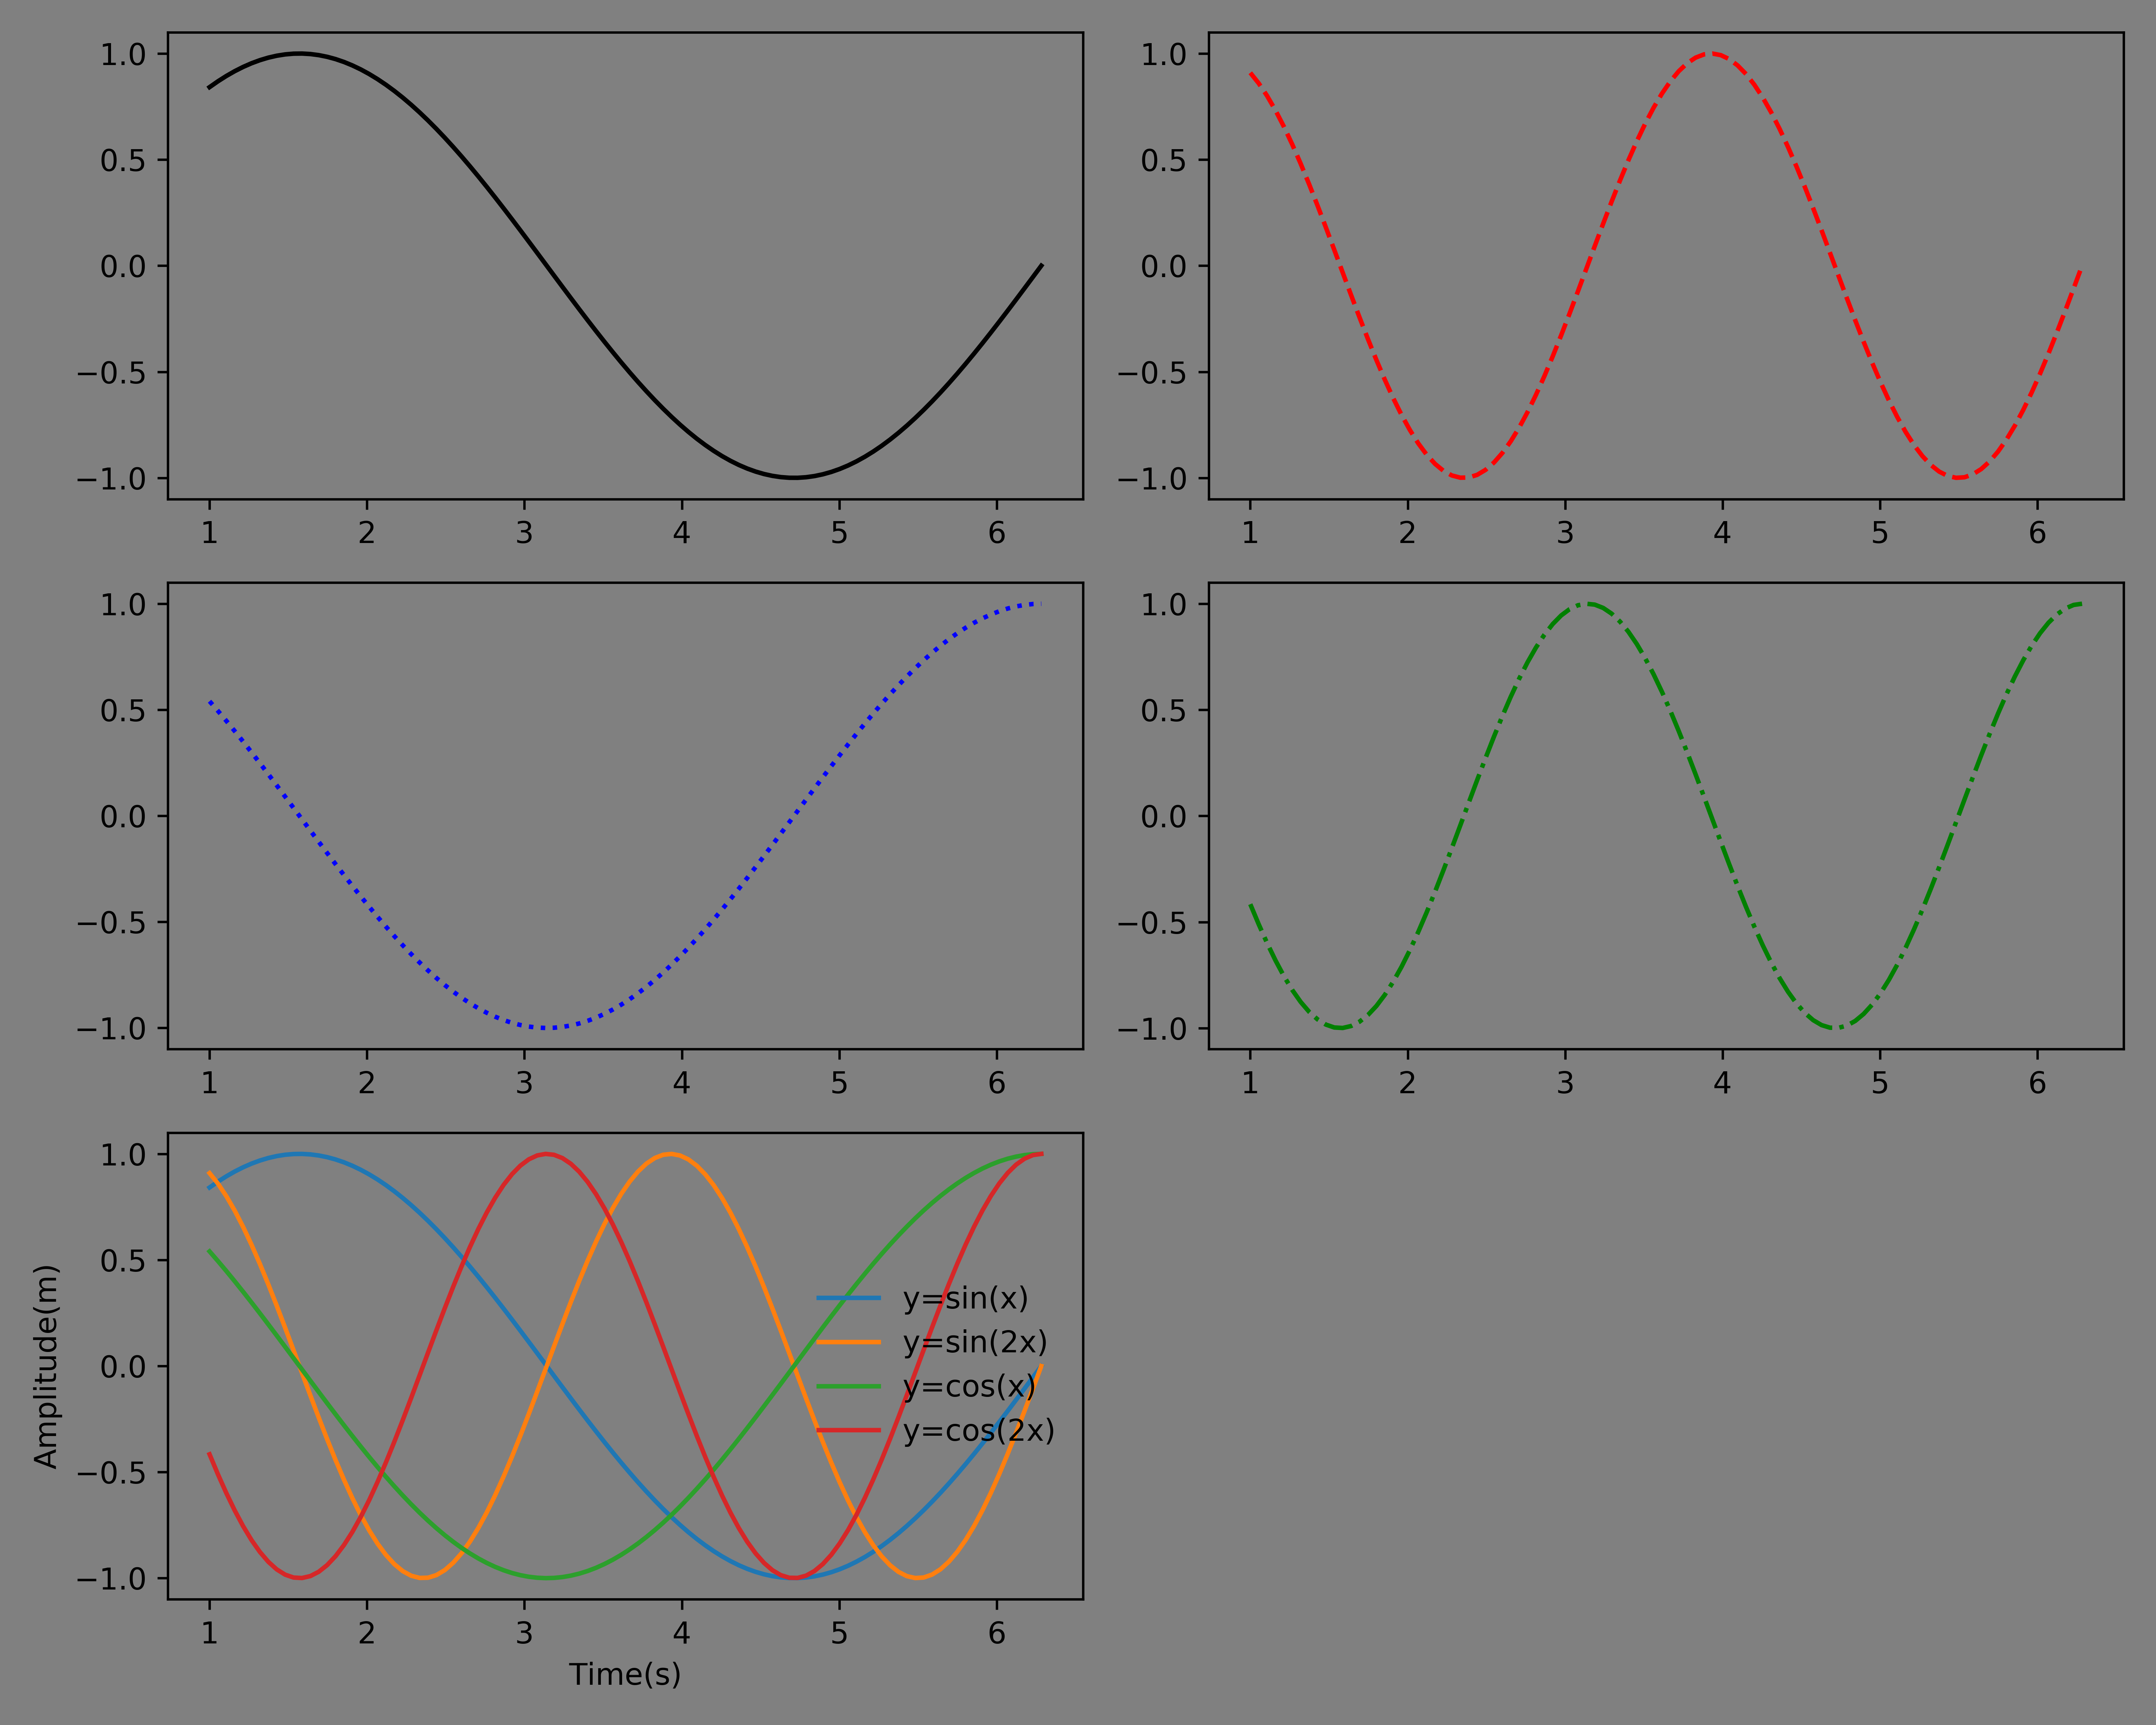
Line Style
- Code
- 效果

Customize Setting
DarkMode
fig,ax=plt.subplots()
# darkmode figure
fig.set_facecolor('gray')
fig.patch.set_facecolor('gray')
fig.set_alpha(0.6)
fig.patch.set_alpha(0.6)
ax.set_alpha(0)
ax.patch.set_alpha(0)
思路是将
figure的底色改为gray, 且设置axes的颜色为完全透明。
已修改matplotlibrc文件使得默认的图像颜色设置为暗黑模式。见附录。
Chinese in Matplotlib
- 下载需要的字体(linux下貌似可以使用Mac的字体),如
SimHei -
$ python import matplotlib matplotlib.get_configdir() '/home/xxx/.config/matplotlib' $ vi ~/.config/matplotlib/matplotlibrc font.family: sans-serif font.sans-serif : SimHei, Bitstream Vera Sans, Lucida Grande, Verdana, Geneva, Lucid, Arial, Helvetica, Avant Garde, sans-serif $ sudo cp SimHei.ttf /usr/local/lib/python3.6/dist-packages/matplotlib/mpl-data/fonts/ttf # for python in anaconda: anaconda3_install_dir/lib/python3.6/site-packages/matplotlib/mpl-data/fonts/ttf $ rm -fr ~/.cache/matplotlib/fontCache # for python in anaconda: rm -fr ~/.cache/matplotlib $ relogin -
# for python 2
#coding=utf-8
#coding:utf-8
#-*- coding:utf-8 -*-
import matplotlib.pyplot as plt
plt.rcParams['font.sans-serif']=['SimHei'] #用来正常显示中文标签
plt.rcParams['axes.unicode_minus']=False #用来正常显示负号
ax.set_xlabel(u'你好')
Modify Default Settings
matplotlibrc修改文件~/.config/matplotlib/matplotlibrc,如legend.frameon: False, 效果和在绘图脚本中关闭legend的frame相同。
新建一个硬链接到gitRepos/config中,从而更好的备份和修改matplotlib设置。- 对于
pip3安装的matplotlib位置为~/.local/lib/python3.6/site-packages/matplotlib/mpl-data
- 对于